


Year-End Report: 2024’s Hottest Rental Market and What’s Next for 2025
Editor’s note: The below article covers multiple metro areas across the US. We asked for information related specifically to the boroughs of New York City (there was no data specific just to Staten Island):
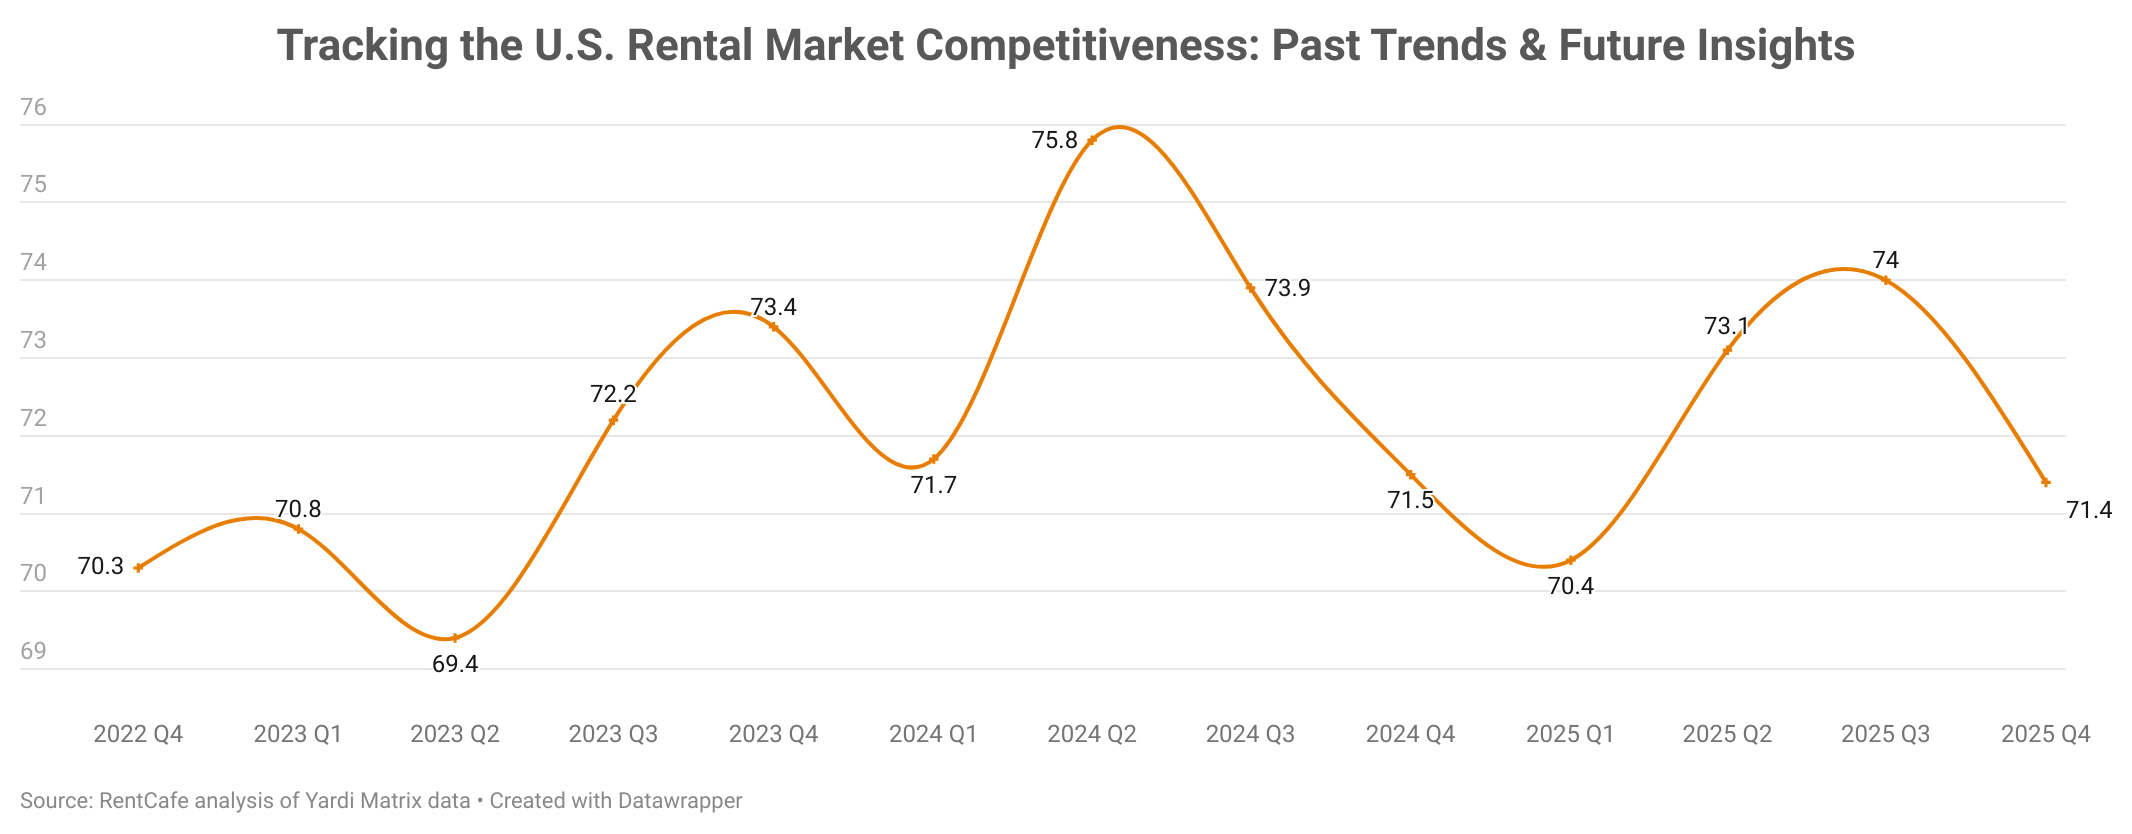
As the year winds down, our team at RentCafe.com released a Rental Competitiveness Report that explores how tough it was to find a rental in 2024 and what renters can expect in 2025.
To uncover these insights, we analyzed everything apartment-related in 139 U.S. metro areas, including vacancy periods, occupancy rates, number of renters per unit, lease renewal rates, and new construction.
Despite the U.S. apartment supply increasing by 2.6%, the demand was high throughout the year, with 9 renters competing for an apartment and more than 60% of tenants renewing their leases. As a result, 93.6% of rentals were occupied in 2024, and vacant units stayed on the market for 40 days.
Here’s a review of the rental market competitiveness, based on 5 key findings:
- Miami emerged as the nation’s hottest rental market this year, but Suburban Chicago and Milwaukee are quickly closing in.
- In Lehigh Valley, PA — 2024’s hottest small rental market — over 80% of renters stayed put due to extremely limited options.
- The national Rental Competitiveness Index (RCI) score of 74.4 out of 100 highlights a highly competitive market, as more renters renewed compared to 2023 — a trend set to continue next year.
- Louisville, KY, stands out as the fastest-rising rental market in 2024, with its RCI score climbing 8.8 points from last year to 76.3. Other markets gaining traction include The Piedmont Triad, NC; Silicon Valley; and Las Vegas.
- With a significant number of new apartments slated to open in 2025, next year’s rental market will be only slightly less competitive than this year.
Just a quick heads-up: Another way to see all these all these trends and patterns on a more granular level is by exploring the additional visuals included in our full report: https://www.rentcafe.com/blog/rental-market/market-snapshots/most-competitive-rental-markets-this-year/
Some highlights from the above report:
The Northeast stays very competitive despite many new apartments opening this year
Known for its supply challenges and higher-than-average home prices, the Northeast also emerged as a tough region for renting, with eight major metros ranking in the top 30 for 2024. This is no surprise, as this area offers a good mix of job opportunities in industries like finance and tech; world-class education with universities such as Harvard and MIT; and extensive public transportation systems that make commuting a breeze.
Leading the pack in the Northeast is Bridgeport-New Haven, CT, which ranks #1 in the region and #4 in the U.S. with an RCI score of 83.4, up from 76.8 in 2023. Here, steady population growth, fueled by families and younger renters — including from abroad — who are drawn to biotech and education jobs has increased competition in the area.
However, this surge in demand has strained the already limited housing supply with new apartment construction slowing from 1.90% last year to 1.23% this year. As a result, renters now face tight conditions with only 4.5% of units available. That prompts 63.1% of residents to renew their leases, which is slightly more than last year. On average, apartments in Bridgeport–New Haven stay vacant for 38 days, with 14 renters vying for each unit.
Next, North Jersey is the nation’s sixth hottest rental market and second in the Northeast. Its high appeal comes from its close location to New York City; excellent transportation options; and a strong job market, especially in tech and innovation.
Of course, high home prices and living costs have made renting the preferred choice for many in this part of New Jersey — but there still isn’t enough housing to meet the demand, even with a 2.64% increase in new apartments, which is well above last year’s supply growth. That’s why 70.8% of apartment-dwellers renewed, which is slightly more than in 2023, pushing the occupancy rate to a high 95.6%. As a result, vacant units in places like Jersey City; Hoboken; Newark; and Morristown are filled within an average of 38 days, with 12 renters competing for each apartment.
New York City’s economy and lifestyle are the driving force behind the competition for rentals in the Northeast
In particular, Brooklyn, NY, shines as the 12th hottest renting spot in the U.S. and sixth in the Northeast with its RCI score climbing from 75.1 in 2023 to 80.6 this year. Although new apartments account for 2.13% of the borough’s housing supply (a significant increase from 2023) rentals remain incredibly scarce. This has led 69.8% of Brooklyn renters to renew their leases — a whopping 5.2% increase from last year. Furthermore, with less than 4% of the apartments in Brooklyn available, competition is fierce with 10 renters vying for each unit, which typically stays on the market for 39 days.
Manhattan (RCI score 78.9) follows far behind, claiming 19th place in the U.S. and sixth in the region— but living in the heart of the action doesn’t make the search for apartments much easier. With new units accounting for a mere 0.25% of the local supply, the occupancy rate stands at 95.2%, which is slightly higher than in 2023. This prompted 64.7% of apartment-dwellers to stay put, which represents a 2.2% increase since last year. That said, vacant apartments in Manhattan are filled within 40 days, on average, with eight renters competing for each unit.
Methodology
To compile this report, RentCafe.com’s research team analyzed Yardi Systems apartment data across 139 rental markets in the U.S. The data comes directly from market-rate, large-scale, multifamily properties of at least 50 units. Fully affordable multifamily properties were excluded.
The markets were ranked based on a market competitive score. To calculate each market’s score, we ranked them according to five metrics and their averages for January through September 2024 — apartment occupancy rate; average total days vacant; prospective renters per vacant unit; renewal lease rate and share of new apartments completed during the same timeframe.
We then compiled an average ranking by assigning a percentage weight for each metric: 30% for apartment occupancy rate; 15% for average vacant days; 15% for prospective renters per vacant unit; 30% for renewal lease rate; and 10% for the share of new apartments.
In this study, the terms “market,” “area,” “metro,” and “location” are used interchangeably and are as defined by Yardi Matrix markets.
Banner Image: For Rent. Image Credit – Lance Grandahl

