

Leaving NYC? 352K New Yorkers Say Goodbye to the City, While Just 174K Moved In
Editor’s note: This previous story from Property Shark contains details about where Staten Island falls in the greater New York City area for property tax rates.
In addition, the following information was received specific to Staten Islanders who have left NYC and who have moved to Staten Island:
Do you have more details about the Staten Island migration trends, perhaps related to the incomes of the people who left vs. those who moved in? Or possibly which of the other boroughs they were most likely to move to.
You can find the migration data for Staten Island bellow:
Out of the 20.5k residents who left Staten Island, the top 5 destinations include 2 from New York (Brooklyn and Manhattan) and 3 from New Jersey (Monmouth, Middlesex and Ocean counties).
| County | State | Outgoing | Income Out |
| Kings County | NY | 2,564 | 37,164 |
| Monmouth County | NJ | 2,019 | 64,617 |
| Middlesex County | NJ | 1,789 | 48,292 |
| Ocean County | NJ | 763 | 51,672 |
| New York County | NY | 717 | 91,149 |
Of the 18.3K people who moved to Staten Island, the top 5 origin counties are predominantly from NYC:
| County | State | Incoming | Income In |
| Kings County | NY | 10,961 | 27,748 |
| Queens County | NY | 1,288 | 31,477 |
| New York County | NY | 916 | 43,956 |
| Bronx County | NY | 500 | 22,988 |
| Middlesex County | NJ | 372 | 43,973 |
The highest number of residents who moved from Staten Island to other counties are in New Jersey (6.8K), New York (5.4K), Florida (2.5K), Pennsylvania (820) and Texas (373), while in the other direction, 14K people from other New York counties moved to Staten Island:
| State | Outgoing | Incoming |
| NJ | 6,845 | 1,468 |
| NY | 5,409 | 14,138 |
| FL | 2,504 | 190 |
| PA | 820 | 80 |
| TX | 373 | 0 |
Top 5 incomes of the people who left vs. those who moved in:
| County | State | Outgoing | Income Out |
| Morris County | NJ | 115 | 114,957 |
| New York County | NY | 717 | 91,149 |
| Collier County | FL | 109 | 86,844 |
| Westchester County | NY | 161 | 85,000 |
| Palm Beach County | FL | 369 | 78,225 |
| County | State | Incoming | Income In |
| Palm Beach County | FL | 68 | 52,794 |
| Hudson County | NJ | 261 | 51,276 |
| King County | WA | 31 | 51,226 |
| Nassau County | NY | 163 | 47,742 |
| Middlesex County | NJ | 372 | 43,973 |
Remote work has driven many people to leave expensive cities for more affordable destinations and better chances at homeownership. As a result, more residents left NYC than moved in — 325K moved out, while only 174K people relocated to the city. At the same time, 125K residents moved between boroughs.
PropertyShark’s report dives into the latest IRS data to uncover where New Yorkers are heading, where they’re coming from, and which boroughs lost more residents than they gained.
Here are some key migration trends:
- Within the city, 125.5K locals packed up and moved to a different borough. Manhattan lost more residents (35K) than it managed to attract (26K), as did Brooklyn (45K out, 35K in) and the Bronx (17K residents left, 16K moved in). Queens and Staten Island attracted more New Yorkers from the other boroughs than they lost in the shuffle — 33K moved to Queens while 23K left and Staten Island welcomed nearly 14K move-ins while losing about 4K to other boroughs.
- Those moving into NYC hail mostly from elsewhere in New York State (40.5K), New Jersey (24K), California (16K) and Florida (10K).
- In terms of net migration, domestic migration data showed that NYC came out of top against major U.S. tech hubs — San Francisco lost more residents to NYC than it attracted from it, as did Silicon Valley tech hubs Fremont and San Jose, Boston, Washington, D.C., and Chicago.
- Notably, high earners were more likely to move into the city than out of it, specifically those earning $100,000 per year or more.
- Most of the 325K New Yorkers moving out didn’t go very far: nearly 51% of outgoing New Yorkers stayed in the tri-state region — about 179K relocated to various counties within New York State, New Jersey, and Connecticut.
Dive deeper into NYC’s domestic migration trends and learn how the city came out on top in relation with several major U.S. tech hubs, from our PropertyShark report: https://www.propertyshark.com/Real-Estate-Reports/2024/12/19/domestic-migration-in-and-out-of-nyc-2024-snapshot/.
Loving or Leaving New York: Domestic Migration in & Out of NYC
Key Takeaways:
- NYC is at a loss as more taxpayers left the five boroughs than outside residents who moved in
- Half of New Yorkers leaving the five boroughs relocated within the greater tri-state area, with Florida being the second-most popular destination
- Within the city, Brooklyn and Manhattan saw the most residents relocating to other boroughs
- The tri-state area and California were the main sources of new NYC residents moving in
- Between NYC and the country’s top tech hubs, NYC attracted more residents than it gave up
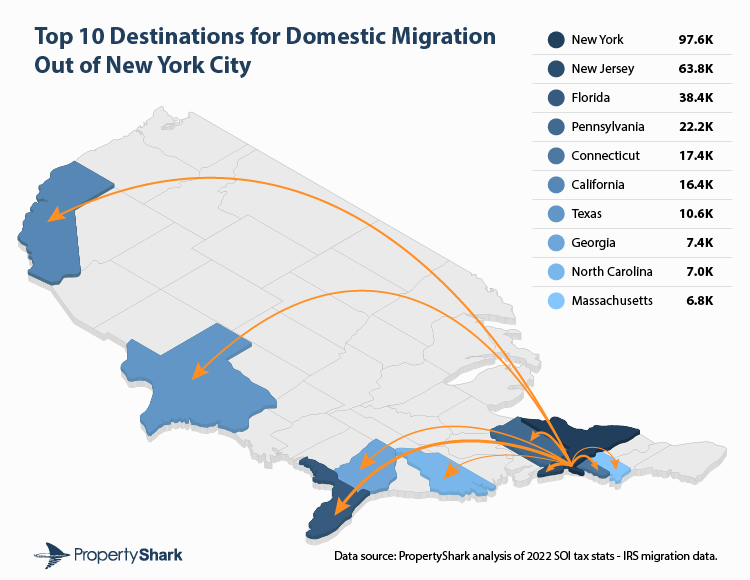
- Among New Yorkers migrating out, New Jersey and Florida were the top destinations of choice
- Income data showed that only earners making at least $100,000 per year were more likely to seek New York than to leave it
The onset of the COVID-19 pandemic in 2020 sent ripples through practically every aspect of life, culture and the economy in the U.S. And, when remote work was at an all-time high during the first few years of the pandemic, a wave of domestic migration swept the country as residents of high-cost gateway metros sought financial relief and a better chance at the dream of homeownership.
Although NYC was not spared from the outflow of residents moving away, it nevertheless continued to attract transplants from elsewhere in the country. So, for a more granular understanding of recent domestic migration in and out of the five boroughs, we looked at the most recent IRS data on year-to-year address changes reported on individual income tax returns. Read our findings below.
352,000 Residents Leave NYC, Half Stay in Tri-State Area
NYC was among several large cities in the U.S. to be negatively affected by domestic migration. In fact, according to 2022 IRS stats, roughly 174,400 people moved to NYC in 2022, whereas a total of around 352,100 left the city. This resulted in a net loss of nearly 177,800 New Yorkers.
Notably, about half of outgoing New Yorkers didn’t move very far: Data showed that approximately 161,400 of those 352,100 moved elsewhere within the state or out to New Jersey. Then, when adding the nearly 17,500 transplants to Connecticut, we see that almost 179,000 residents (nearly 51%) who left NYC remained in the tri-state area.
Read on for a deeper dive into the ins and outs of NYC migration, including where Big Apple residents moved to in the U.S., where new residents came from and what the migrating currents looked like in terms of income bracket.
Taking a Break From the Neighborhood: 125,000 New Yorkers Shuffle Between Boroughs
IRS migration data showed that about 125,500 residents moved within the city from one borough to another. As you might expect, Manhattan was the destination of choice for a little more than 26,000 New Yorkers from the outer boroughs. The skyscraper-laden island became home to more than 10,800 former Brooklyn residents; around 8,400 from the Bronx; just more than 6,000 residents formerly residing in Queens; and a little more than 700 from Staten Island.
At the same time, more than 35,300 New York County residents changed their address to the outer boroughs. With recent home sales in Manhattan changing hands for a median price of $1 million — as well as a housing stock that’s notoriously insufficient on the high-density island — the borough’s overall net migration loss of nearly 9,300 residents is hardly surprising.
Among the five boroughs, Brooklyn and Queens received the most New Yorkers from elsewhere in the city. Brooklyn became home to 35,500 residents from other boroughs, including about 16,400 from Manhattan; roughly 12,600 from Queens; and nearly 4,000 from the Bronx.
Meanwhile, about 33,300 New Yorkers moved to Queens from a different borough, most of them hailing from Brooklyn. As a matter of fact, the roughly 19,300 residents to move their tax return address from Brooklyn to Queens was more than the influx from Manhattan, the Bronx and Staten Island combined.

Keeping It Metro: In-Migration From New York State & Tri-State Area
The largest influx of new residents from counties outside of the five boroughs originated in Nassau County, N.Y. (12,692). It was followed by Westchester County, N.Y., with 9,564 and Suffolk County, N.Y. (7,323). In total, nearly 40,500 New York state residents from 24 counties moved to NYC in 2022.
Next, New Jersey yielded nearly 23,800 new New Yorkers during that same time — the largest cohort of incoming residents from a different state. Our recent analysis of out-of-state and local homebuyers of NYC property found that this may have been a persistent trend as New Jersey residents remained the most active out-of-state homebuyers here throughout the last decade.
Meanwhile, about 7,500 Connecticut residents also moved to NYC. Overall, this added up to a NYC in-migration of nearly 71,800 from the greater tri-state area.
No Continent Too Wide: West Coast Migration to NYC
California followed New Jersey as the second-largest out-of-state source of incoming New Yorkers (a total of just more than 16,000). In this case, county-level data showed that a little more than 5,400 Los Angelenos chose to move to NYC, marking the largest influx from a county outside of New York state.
Not to be outdone, San Francisco was the second-largest California source of incoming New Yorkers during that same time (roughly 2,990) for the 10th-largest overall influx.
Notably, NYC transplants from San Francisco added up to more than the combined number of residents moving to NYC from the other two West Coast states (2,202 from Washington state and 720 from Oregon).
More New Yorkers Came From Major Tech Hubs Than Moved There
Overall, there was a higher number of counties to which NYC lost more residents than it gained during the surveyed period. However, looking at the other end of the scale (positive net migration), we found that NYC came out on top in relation to several other major U.S. metro areas, some of them home to well-established tech hubs, such as San Francisco, Boston and Silicon Valley.
For instance, San Francisco lost more residents to NYC than it attracted from it: Nearly 3,000 new NYC residents came from here, while only about 1,600 moved the other way around during that same time. This added up to a positive net migration of nearly 1,400 residents for NYC, which was also the highest such county-to-county gain recorded.
Furthermore, NYC also attracted more taxpayers than it yielded when compared to the Bay Area’s Alameda and Santa Clara counties, which are home to California’s Silicon Valley tech hubs Fremont and San Jose, respectively. Nearly 900 New Yorkers changed their address to Alameda County, whereas only about 1,340 adjusted the other way around — a gain of roughly 440 taxpayers for NYC.
At the same time, about 1,160 NYC residents moved to the San Jose, Calif., area, while a little more than 1,420 chose the five boroughs over San Jose (260 net migration gain for NYC).
The next-highest NYC migration gains after San Francisco were from Boston. In this case, migration from NYC to Suffolk County, Mass., saw roughly 1,550 moves made, while nearly 2,400 made the move in reverse for a net gain of nearly 800 taxpayers for NYC.
Similarly, data showed slightly larger numbers moving between NYC and Middlesex County, Mass. — 1,860 from NYC to the greater Boston metro area and a little more than 2,400 the other way around, which added up to nearly 560 more residents in favor of NYC. In total, NYC gained roughly 1,350 taxpayers from these two Boston metropolitan area counties.
Then, the third- and fourth-highest NYC migration gains came from the District of Columbia and Cook County, Ill. (Chicago). While a little more than 1,600 New Yorkers moved to Washington, D.C., nearly 2,190 changed it the other way around, translating to a little more than 560 taxpayers in favor of NYC.
At the same time, Chicago became home to nearly 2,670 incoming New Yorkers, whereas 3,160 taxpayers changed their address from the city by Lake Michigan to the city on the East River — a little more than 500 residents gained by NYC.


