. Staten Island News.")

NYC Falls To 36th On Top 50 List Of Highest STD Rates Nationwide – Well Behind Philadelphia, Memphis, San Francisco Across Nation
These U.S. Cities Have the Highest STD Rates
Our research team pes deep into the CDC’s latest STD Surveillance Statistics and provides our analysis of current trends in 2024.
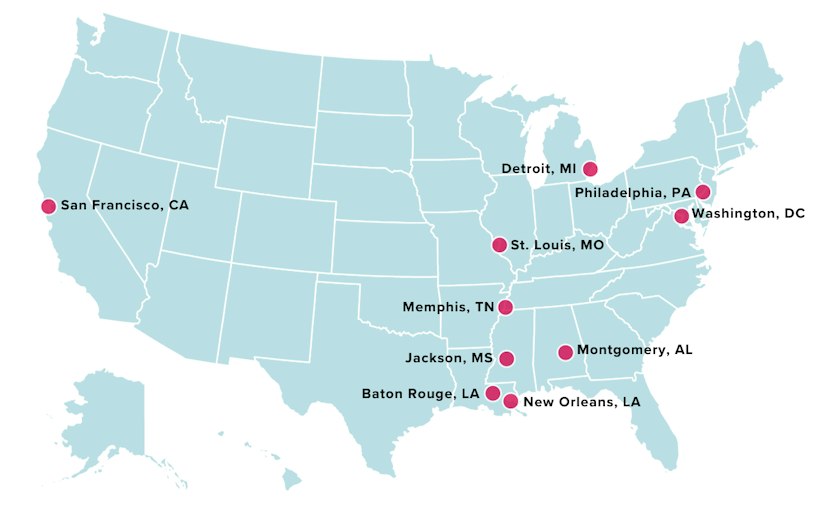
Top 10 Cities for STD Rates Nationwide. Image Credit – Innerbody Research
From the study’s author, in response to our question:
Q-Do you have any specific information you can share about Staten Island or New York City, with regard to rates of STDs, and whether they have increased or decreased, as well as if they are the same diseases that have been seen previously? It is encouraging to see that NYC is not in the top 25.
A-While specific data for Staten Island is not available, I can provide you with last year’s statistics for New York City and offer insights based on a year-to-year comparison.
Last year’s data is as follows:
- Chlamydia: 60,779
- Gonorrhea: 26,388
- Syphilis: 6,521
- HIV: 1,082
This data reveals a consistent increase in cases of chlamydia, gonorrhea, and HIV. Notably, there is a significant decline in syphilis cases, contributing to a lower ranking this year. Despite the general upward trend in STD cases across the U.S., it appears that New York’s increase in specific STDs is relatively moderate compared to other regions, resulting in a lower ranking this year.
For our 7th annual study of STD rates, based on the latest data published by the Centers for Disease Control and Prevention (CDC), Innerbody Research analyzed statistics on a city-by-city basis and developed our list of the Top 100 cities with the highest STD rates. In this year’s report, the city with the highest STD rate was Philadelphia, PA, overtaking Memphis, TN, which moved to 2nd. This, in turn, pushed Jackson, MS, from 2nd to 3rd in our rankings.
In addition to ranking the 100 cities with the highest STD rates, below we’ll provide some takeaways from our report, spotlight cities whose STD rates have significantly improved or declined, highlight racial disparities that emerge from the CDC data, scrutinize a notable omission in data, and explore why this year’s data is somewhat unique from recent years’ studies.
Quick takeaways
- The South continues to suffer — but even more so — relative to other regions of the country.
- This is the first post-lockdown STD data that the CDC has released in the Covid era, and it isn’t reassuring.
- Syphilis rates are on a disturbing and deadly rise, with tragic consequences for newborns.
- Where is the STD case data from the Baltimore, MD metropolitan area?
- Want to settle in a city with consistently low STD infection rates relative to other urban areas? Our study would suggest Provo, UT.
Notable movement (or lack thereof) in our rankings
Last year, our study found that Philadelphia, PA, was suffering from the 5th worst STD infection rates among U.S. metro areas. Even so, its rates worsened relative to other cities in this year’s study. As a result, it now leads all major metropolitan areas with the highest infection rates.
Meanwhile on the West Coast, as San Francisco, CA, has faced its share of well-documented challenges, it experienced a decline in our rankings assessment as well. In our previous study a year ago, available CDC data led the city to improve by three ranks, yet this year, it deteriorated from 15th to 8th — leapfrogging metropolitan areas like the District of Columbia, Little Rock, AR, and Norfolk, VA, which moved very little.
There’s one city that hasn’t moved much in our rankings — but in a positive way. Coming in at 99th last year, Provo, Utah, narrowly improved on its relatively stellar standing to secure 100th this year — the best among the 100 metro areas in our study.
Southern cities face challenges
In past years, we’ve made the worrisome observation that the South, as defined by the Census Bureau, contributes a disproportionate number of metro areas to the upper portions of our rankings in our annual study.
Last year, for instance, 14 of the 25 U.S. cities with the highest STD infection rates were in the South. That means a region with roughly 39% of our nation’s population contributes over half of the 25 cities with the worst STD infection rates.
But this year, the number of southern cities has risen to 17 of that top 25, or just over two-thirds. This overrepresentation in our study is disturbing. Two of last year’s top 5 cities find themselves in nearly the same unenviable position in our latest study:
- Memphis, TN (was 1st, now 2nd)
- Jackson, MS (was 2nd, now 3rd)
One capital city, however, appears to be bucking this trend: Columbia, SC, which ranked 3rd highest in our study last year but has since improved to 21st this year.
Charlotte, NC, has also improved dramatically in our rankings: in our prior study, it had the 13th worst STD infection rates, but that ranking improved to 28th this year.

Chlamydia and gonorrhea on the rise as syphilis surges
New cases of gonorrhea (over 710,000 of them) and chlamydia (over 1.6 million) signal to the CDC that chlamydia rates have risen back to pre-2020 levels, while gonorrhea rates continue to increase across our cities; unlike chlamydia, confirmed cases of gonorrhea never slowed in 2020.
Meanwhile, syphilis rates have risen by a massive 28.6% since the last study. But the rise in the congenital syphilis rate nationally is even more staggering (30.5%), constituting a tenfold increase in newborn syphilis cases over the span of a decade. These numbers mean that, since 2001, syphilis cases in our nation have increased 781%. Cases of congenital syphilis during that 20-year span rose by 464%.
Tragically, there were 220 cases of stillbirth or infant death in the U.S. due to the disease over the course of the most recent year for which the CDC provides its data. The thousands of infants who survive face lifelong health issues due to the infection.
Every city and state is feeling the effects of the surge in congenital syphilis, but communities in California, Texas, Florida, Arizona, and Louisiana feel it most profoundly — at this time, those five states collectively account for nearly 60% of reported cases.
Social and racial disparities
Though growing infection rates affect nearly all communities, the STD burden within our cities hits minority racial and ethnic groups the hardest. When comparing infection rates of White people to those of some minority racial and ethnic groups, the CDC data shows that dramatic disparities remain.
A closer look at the rise in syphilis rates illuminates these racial disparities.
Alaska Native or American Indian people account for only 0.7% of live births during this year of the study, yet those newborns account for nearly 4% of the congenital syphilis cases. Meanwhile, non-Hispanic Black people make up about 12% of the U.S. population but suffer 31% of the cases of chlamydia, gonorrhea, and primary and secondary syphilis.
Health leaders stress that differences in sexual behavior aren’t the explanation for these differences in rates of infection. What can spell the difference between life and death, or illness and health, are timely testing and treatment — but it has to be both. Nearly 90% of these cases of newborn syphilis were preventable through testing and treatment during pregnancy.
Barriers to timely testing and treatment include lack of health insurance, poverty and housing issues, substance use disorder, and lack of sufficient public health infrastructure. All of these factors continue to affect minority racial and ethnic groups disproportionately.
“While newborn syphilis cases are increasing nationwide and across every racial and ethnic group, some communities, including those of people who are Black, Hispanic, and American Indian or Alaskan Natives, are experiencing the brunt of the newborn syphilis epidemic,” says Laura Bachmann, MD, MPH, FIDSA, FACP, the chief medical officer in the CDC’s pision of STD Prevention.
Effects of the pandemic on STD infection: worrisome and not yet fully revealed
When the CDC examined data from 2020 a couple of years ago, it had been significantly impacted by socially disruptive lockdowns. And yet, nonetheless, infection rates rose year over year. In other words, we were not socializing more, yet we were spreading STDs at higher rates.
This trend only underscores what CDC officials have said about the vital importance of public health infrastructure to the prevention of the spread of STDs. It’s not enough that we see one another less. Reliable and relatively easy access to testing and treatment for STDs is of paramount importance if our goal is to lower STD rates.
While the socially disrupted year 2020 still produced increases in STD infection rates compared to the year prior, the latest CDC data shows that what followed yielded infection rates that were worse still.
2021 was unaffected by various lockdowns or shelter-in-place mandates, yet public health infrastructure remained significantly frayed and has yet to recover. Effectively, what has happened is that normal patterns of life returned, but without the easy ability to access sexual health testing and subsequent treatment.
For these reasons, with such disruption to routine community healthcare access, the CDC anticipates that its latest data (upon which this study relies) likely underreports infection counts and underestimates infection rates.
The Rankings: Top 25 U.S. cities with the highest STD rates

1
1. Philadelphia, PA

2
2. Memphis, TN

3
3. Jackson, MS

4
4. New Orleans, LA

5
5. St. Louis, MO

6
6. Baton Rouge, LA

7
7. Montgomery, AL

8
8. San Francisco, CA

9
9. Detroit, MI

10
10. Washington, DC

11
11. Little Rock, AR

12
12. Norfolk, VA

13
13. Portland, OR

14
14. Mobile, AL

15
15. Cleveland, OH

16
16. Miami, FL

17
17. Minneapolis, MN

18
18. Laredo, TX

19
19. San Antonio, TX

20
20. Milwaukee, WI

21
21. Columbia, SC

22
22. Richmond, VA
23
23. Fort Lauderdale, FL

24
24. Lexington, KY

25
25. Augusta, GA
Banner Image: STD map of United States. Image Credit – InnerBody Research


InnerBody Research
We're Innerbody — researchers, scientists, and medical professionals with a shared mission: To provide objective, science-based information and advice that helps you make health-related decisions and enjoy a healthier, happier lifestyle. Our experienced research team tests, analyzes, and compares your best options, sparing you the time and money so you can make quick, confident progress toward your health goals. And together, we strive to put common health concerns in broader context with research studies and pertinent analyses that illuminate the complex picture of health in the United States.
There are no comments yet
Why not be the first