

Staten Island Homeowners: Highest Proportion Of Couples Citywide, Lowest Of Non-Family (Roommate) Households
Our study focused specifically on ownership demographics, not on retail or commercial activity, so we can’t speak to that with the same data-backed precision.But what we can say is that a borough dominated by married-couple homeowners, many in detached single-family homes, implies a very different consumer base than what you’d find in Manhattan or the Bronx. We’re looking at a population that is more family-oriented, more car-dependent, more likely to have children and more likely to spend on home improvement, family-oriented services and suburban-style retail.
-
35% of Shore Acres homeowners are female-led families, making it one of just five NYC neighborhoods where they are the dominant owner type
-
7% of Staten Island homeowners are male-led families, the second highest share across the five boroughs
-
Nonfamily owners account for 21% in Staten Island, the lowest share citywide
-
Only 8% of NYC homes are owned by under-35-year-olds, compared to 38% owned by those 65 and older
NYC Homeownership by the Numbers: How Household Type, Gender & Age Shape Who Owns in Every Neighborhood
In a city where homeownership is dominated by married-couple families, Manhattan stands as the only borough led by nonfamily owners. At the same time, residents younger than 35 make up less than one tenth of the ownership pool and female-led family households outnumber male-led families across 91% of NYC neighborhoods.
Key Takeaways:
- Married-couple families are the dominant owner type in eight out of 10 New York City neighborhoods and make up 51% of the citywide ownership pool
- Manhattan is the only borough where nonfamily owners lead (48%), but the Bronx’s Concourse is the #1 neighborhood for nonfamily owners
- Mill Basin leads for married-couple family homeownership at 75%, followed by two Staten Island neighborhoods — Concord (74%) and Charleston (73%)
- Female-led family households lead ownership in five neighborhoods and exceed their male counterparts in 254 out of 278 neighborhoods
- Male-led family households are not the predominant ownership type in any neighborhood, with Mount Hope recording the category’s highest share at 29%
- Only 8% of NYC homes are owned by under-35-year-olds, while owners older than 65 hold 38%
The NYC homeowner’s profile reveals striking patterns about family structure, gender, age and geography, including where women own more than men, which neighborhoods are dominated by married owners versus nonfamily owners and exactly how many residents younger than 35 own property.
To determine these patterns, we broke down owners of owner-occupied homes by Census household type:
- Married-couple family households (also referred to as married-couple families in this study): A married couple living together with or without children
- Nonfamily households (also referred to as nonfamily owners): Individuals living alone or only with non-relatives
- Female-led family households (also referred to as female-led families): A woman owning a family home without a spouse present, living with at least one relative. Includes never-married, divorced, separated or widowed owners
- Male-led family households (also referred to as male-led families): A man owning a family home without a spouse present, living with at least one relative. Includes never-married, divorced, separated or widowed owners.
We then layered age data on top, revealing the dominant ownership profile: NYC’s typical homeowner is married, older than 35 and living outside of Manhattan. Our analysis also showed that married-couple families are the leading owner type in 225 of 278 NYC neighborhoods and residents older than 35 hold 92% of owner-occupied homes. Otherwise, the exceptions are rare: Female-led families are the dominant owner category in just five neighborhoods and male-led families do not hold the top spot in any.
Borough-Level Breakdown
Married-Couple Families Lead Homeownership in Most of NYC, Manhattan Breaks Pattern
New York City’s homeownership rate stands at just 33% or roughly half the national rate of 65%. Not only that, but in NYC, the ownership breakdown looks noticeably different from the rest of the country: Married-couple families hold 51% of owner-occupied homes, representing the largest group. However, that figure still stands below the 59% share nationally, reflecting a city where traditional family homeownership is less dominant.
Meanwhile, in a market defined by dense, compact housing that attracts single professionals and unrelated roommates, nearly one-third of NYC homes belong to nonfamily owners, which is above the national rate of 27%. And, perhaps most notably, female- and male-led families hold 13% and 6% of owner-occupied homes, respectively, each roughly 50% higher than the U.S. average.
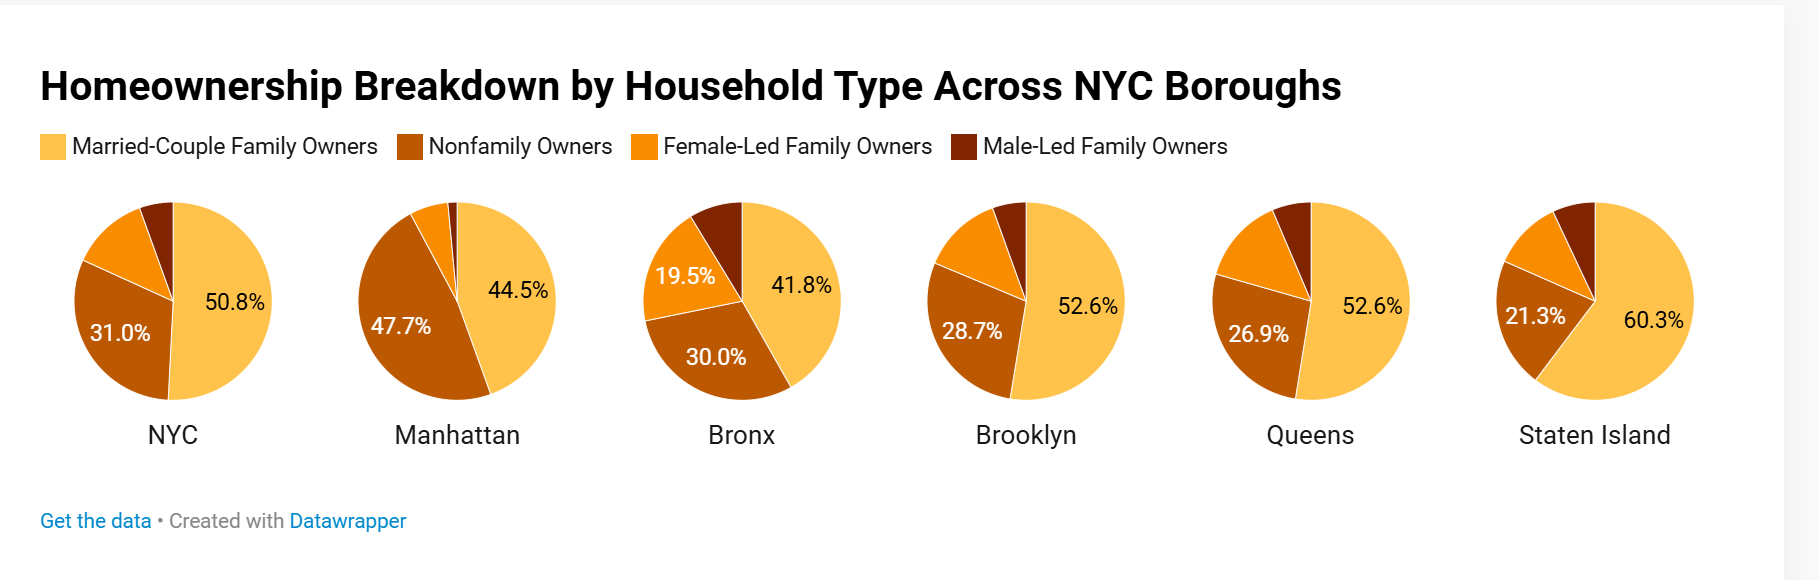
Among NYC’s boroughs, Staten Island stands out with the second-highest ownership share among male-led families at 7%, significantly above Manhattan’s. Even so, Staten Island remains the city’s most traditional homeownership market with married-couple families claiming 60% of owner-occupied homes — the highest share of any borough and on par with the national rate. Moreover, ages 35 to 64 account for 39% of all owner-occupied homes held by married-couple families, which is also the city’s highest ownership rate for that cohort.
Queens closely mirrors the citywide pattern with married-couple families making up 53% of the borough’s owners. It also distinguishes itself with the strongest ownership for married-couple families aged 35 to 64: Here, they own 31% of homes. This reinforces Queens’ role as the primary landing spot for middle-aged and older families looking to buy without leaving the city.
Brooklyn’s share of 29% nonfamily owners sits below the city average, while simultaneously skewing slightly above average for married-couple owner types at 53%. This suggests that the borough’s ownership base remains mostly in married couples’ hands.
Notably, Manhattan is the only borough where nonfamily owners outnumber married-couple families at 48% versus 45%, standing significantly above the national share of 27% for nonfamily owners. Senior nonfamily owners are heavily represented, more so here than in any other borough: Nonfamily owners older than 65 hold one-fifth of all Manhattan homes.
This points to a significant population aging in place in co-ops and condos, in addition to challenging expectations of who the typical Manhattan owner is today. At the same time, Manhattan’s male-led family households account for just 1.5% of the ownership pool and female-led households only 6.3%, both representing the lowest ownership shares for the two household types citywide.
The Bronx leads decisively in non-traditional ownership with female-led families holding 20% of owner-occupied homes, double the national rate. Meanwhile, male-led families represent 9% of the borough’s homeowners, more than twice the U.S. average.
The borough also has the city’s lowest share of married couple families among owners, representing just 42% of Bronx homeowners. This is paired with a relatively high ownership share for married-couple families under 35, suggesting that lower price points are opening doors for younger families.
Top Neighborhoods for Married-Couple Families
Mill Basin Tops NYC: Married-Couple Families Own 3/4 of Homes
Looking at the city’s homeownership profile at a more granular level, we analyzed all NYC neighborhoods to see which locations skewed heaviest toward married-couple families and nonfamily owners and which neighborhoods had the highest shares of female- and male-led families among owners.
In NYC neighborhoods where ownership is dominated by married-couple family households, the trend shows that suburban or semi-suburban locations are most popular — and young homeowners are almost entirely absent. More precisely, married-couple families younger than 35 rarely represent more than 1% or 2% of the homeowner pool, illustrating that even the neighborhoods with the largest shares of married-couple family owners remain out of reach for younger couples.


Of all NYC neighborhoods, it is the ownership profile of Mill Basin (#1) that skews strongest towards married-couple families, accounting for 75% of homeowners. Age-wise, almost one third of Mill Basin homeowners are married-couple families older than 65 and just 1% are younger than 35. Mill Basin also has a slightly higher share of male-led families among homeowners than the borough’s average, whereas female-led families are nearly absent — one of the rarer cases in the city.
Since Staten Island has the highest share of married-couple families among homeowners (60%), it’s not surprising that the borough clusters so many of the neighborhoods dominated by them. In fact, in five Staten Island neighborhoods — Concord (#2), Charleston (#3), Lighthouse Hill (#7), Pleasant Plains (#8) and Bay Terrace (#9) — married-couple families make up 72% to 75% of homeowners. Of these, Concord has a more urban profile, while the others are more suburban.
Age-wise, Lighthouse Hill stands out with the complete exclusion of young married-couple families, as no couples younger than 35 own homes here. Conversely, Charleston runs the opposite direction with 7% of all homeowners being young married-couple families.
Chinatown (#4) stands out as a notable entry in the top neighborhoods for married-couple families — which make up 73% of owners — given it’s part of a borough dominated by nonfamily owners. In this case, the explanation lies almost entirely in the age data: Nearly half of all homeowners in the neighborhood are married-couple families older than 65, the highest share in all of NYC.
In Brooklyn, the Columbia Street Waterfront District (#5) and Borough Park (#6) skew heaviest towards married-couple families, which make up 73% of homeowners in both neighborhoods. However, Borough Park is the outlier for age, as married-couple families under 35 make up 7% of all homeowners — one of the highest shares among all NYC neighborhoods. Not far behind, Greenwood Heights (#10) rounds out the top neighborhoods with the highest share of married-couple family owners, making up 71% of the ownership pool.
Top Neighborhoods for Nonfamily Owners
Manhattan Dominates Neighborhoods with Majority Nonfamily Owners, but the Bronx Takes Top Spot
Nonfamily homeownership typically concentrates in dense condo and co-op neighborhoods, with Manhattan claiming eight of the top 10 spots. With more than one quarter of Manhattan homeowners over 65, owners tend to skew older across most of this top-10 list. The exceptions are the two Bronx neighborhoods, which trend younger, pointing to two distinct nonfamily owner profiles.

The Bronx’s Concourse (#1) leads the city at 84% nonfamily owners, of which nearly one third are younger than 35. It must be noted, however, that Concourse has few owner-occupied homes. Plus, unlike many Bronx neighborhoods, Concourse has few female- or male-led families as owners.
Adjacent Port Morris (#2) skews even younger, driven by loft conversions and smaller condo stock attracting early-career buyers. Here, three quarters of its owners are nonfamily households and 45% are nonfamily owners under 35.
A legacy Manhattan co-op corridor follows, defined by smaller units and long-tenured owners: In Central Park South (#3), 73% of owners are nonfamily households, with more than one third of all owner-occupied households held by nonfamily owners over 65. The remaining share of owners in the neighborhood are strictly married-couple families. Similarly, 68% of Tudor City (#5) homes are owned by nonfamily households. In that category, the 35-to-64 and the 65+ age brackets have a balanced split.
In Greenwich Village (#8), 63% of owners are nonfamily households with a near even division between those aged 35 to 64 and seniors, showing how the neighborhood’s mix of pre-war walk-ups and co-ops favors owners aging in place. What’s more, married-couple families represent about one third of Greenwich Village owners, lower than the borough’s 45% average. Plus, female-led families are also underrepresented, holding 4.6% of the neighborhood’s owner-occupied units versus 6.4% across Manhattan.
Newer, high-amenity condo clusters drive much of Manhattan’s nonfamily owner dominance. Namely, 69% of Hudson Yards’ (#4) owners are 69% nonfamily households. They’re also concentrated almost entirely in the 35-to-64 bracket, consistent with a high-income, new-development market.
Next, in the Theater District–Times Square area (#6), 67% of owners are nonfamily households, while in the Clinton–Hell’s Kitchen area (#7) they represent 64%. The two neighborhoods’ ownership profile is driven by professionals working in major employment hubs.
Downtown Manhattan’s boutique condo and loft belt rounds out the list. Specifically, nonfamily owners hold 62% of owner-occupied homes in NoMad (#9) and 61% in NoLiTa (#10). Nolita also skews younger than the borough, with nearly one-quarter of households held by nonfamily owners under 35. It also has an unusually high share of female-led family owners for Manhattan, at 13%.
Top Neighborhoods for Female-Led Families
Female-Led Families Dominate Ownership in Just 5 NYC Neighborhoods
Female-led family households comprised of female owners with no spouse present are the dominant owner type in five NYC neighborhoods: Longwood, Hunts Point, Shore Acres, Mount Eden and Melrose. But their presence is much broader than it seems: Their share of the ownership pie exceeds that of their male counterparts in 254 of the 278 neighborhoods analyzed, including 48 of the 54 Bronx neighborhoods included in this study.
Age-wise, Claremont stands out as the only location where younger owners are the leading age group among the top 10 neighborhoods for ownership among female-led families. This bucks the citywide pattern in which ages 35 to 64 dominate ownership across virtually every demographic.
Longwood (#1) leads NYC in homeownership for female-led families: Here, female-led family households represent 44% of owners, skewing middle aged. Specifically, more than one-third of all Longwood homeowners are female-led families aged 35 to 64.
Nearby, in #2 Hunts Point, 37% of owner-occupied homes are held by female-led families, aged 35 to 64. It must be noted, however, that both South Bronx neighborhoods have small homeowner pools and are considered predominantly rental markets.
Female-led families also narrowly lead in Shore Acres (#3), owning 35% of the neighborhood’s homes, ahead of married-couple families (32%) and nonfamily owners (32%). As such, it stands as Staten Island’s clearest outlier in a borough where ownership is strongly dominated by married couple.
Two Bronx neighborhoods follow with more mixed ownership patterns: Mount Eden (#4) and Baychester (#7). In Mount Eden (#4), female-led families represent 34% of owners. It is also the only neighborhood that stands out for large shares of both female- and male-led families (34% and 15%, respectively) among the local owner pool. In Baychester (#7), female-led families make up 31% of owners, while the rest is almost equally split between married-couple family households and nonfamily owners, reflecting one of the more balanced ownership profiles in the city
Meanwhile, in Brookville (#5), Saint Albans (#6) and Springfield Gardens (#8), one third of owner-occupied homes are held by female-led families but married-couple families are still the dominant owners in all three. This suggests that female-led families are not filling an ownership vacuum here. Rather, they complement large segments of married-couple family owners, especially in communities dominated by owner-occupied homes rather than rentals.
At the same time, 23% of owner-occupied homes in Claremont (#9) belongs to female-led families under 35 — a concentration unmatched anywhere else in the city. In Morrisania (#10) — another small south Bronx market heavy in affordable housing — 30% of homeowners are made of female-led families.
Top Neighborhoods for Male-Led Families
No NYC Neighborhood Is Majority-Owned by Male-Led Families
Male-led families are not the leading owner type in any NYC neighborhood and outperform female-led families in just 21 out of 278 neighborhoods. Among the 10 neighborhoods with the highest shares of male-led family homeowners, eight are from the Bronx and two from Staten Island. Notably, age exceptions among the neighborhoods with the largest shares of male-led family owners skew either older or younger than the city’s dominant 35-to-64 age bracket.
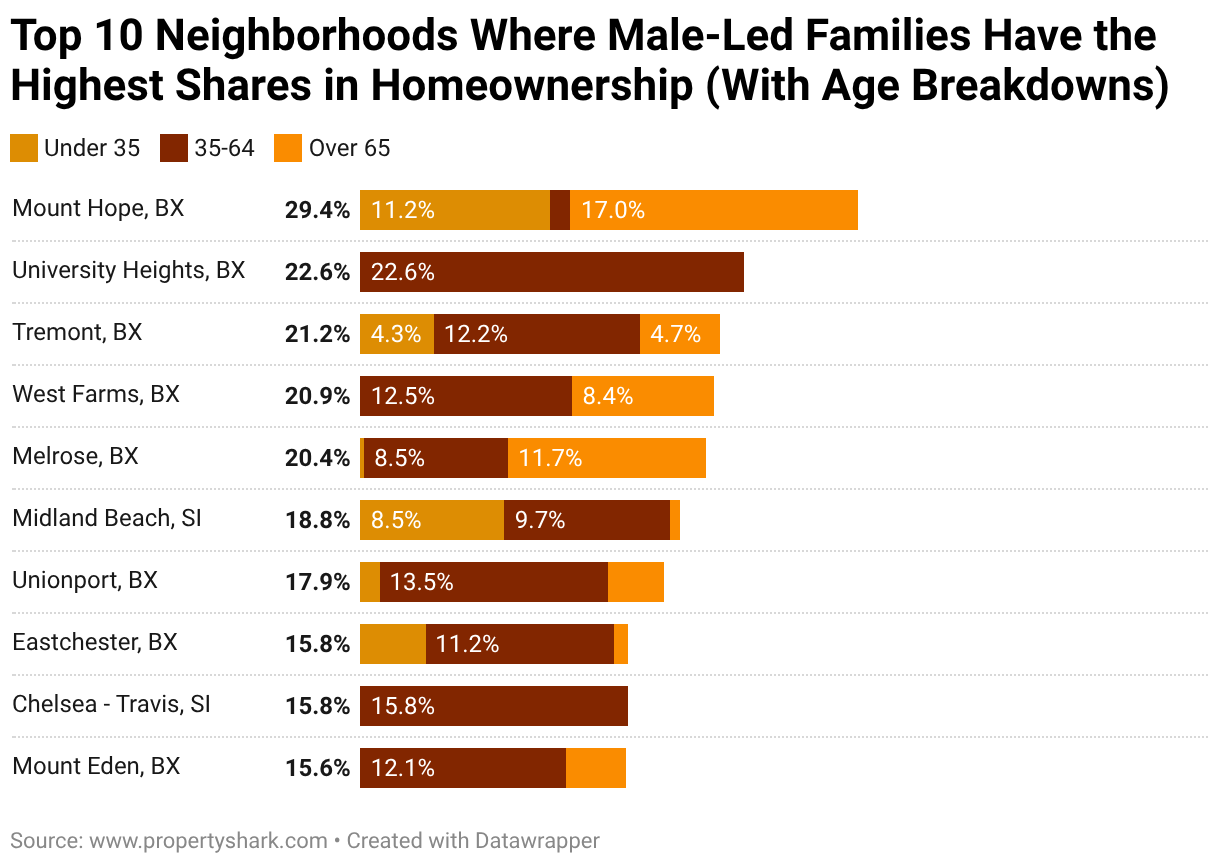
In Mount Hope (#1), 29% of homeowners are male-led families, the highest share in any NYC neighborhood, driven by owners over 65. The neighborhood is otherwise dominated by nonfamily owners (49%) and has relatively few owner-occupied homes, which can amplify category shares.
In neighboring University Heights (#2), 23% of owners are male-led families, all aged 35 to 64. Meanwhile, in both Tremont (#3) and West Farms (#4) male-led families make up 21% of homeowners. In West Farms, 8% of owner-occupied homes are held by male-led families over 65, pointing to a significant senior presence for this owner type. The neighborhood also stands out with one of the smallest gaps between male- and female-led families across all NYC neighborhoods.
Similarly, in Melrose (#5), male-led families make up 20% of the ownership pool, atypically led by seniors, even as the neighborhood’s overall population skews young. This suggests that older generations are more likely to have purchased and aged in place. This is further reinforced by the neighborhood’s renter-dominant profile, which leaves a small inventory of homes for younger would-be buyers.
Over in Staten Island, a borough dominated by married-couple family owners, two neighborhoods stand out with larger numbers of male-led families among owners. In Midland Beach (#6), 19% of homes are owned by male-led families, with a meaningful under-35 presence, unusual for a middle-class, suburban neighborhood. Chelsea–Travis (#9) stands out twofold: 16% of owners are male-led families and they outnumber female-led families four to one.
Similarly, male-led families outnumber female-led families in Unionport (#7) as well, making up 18% of owners versus 11%. In Eastchester (#8), male-led families represent 16% of homeowners, followed by 15% in Mount Eden (#10) — another renter-dominated neighborhood.
NYC Homeownership Defies a Single Definition
In a city with a homeownership rate that is well below the national one, the profile of the typical owner is married, over 35 and likely living outside of Manhattan. However, multiple distinct patterns lay behind this profile.
Married-couple families remain the dominant owner type, but are most concentrated in outer-borough corridors, while female-led families outnumber male-led families in almost every neighborhood’s owner mix. Nonfamily owners claim a larger share than national averages and younger buyers are rare exceptions across the city.
From young married-couple families in spacious single-family homes on Staten Island to senior residents living alone in Manhattan co-ops, homeownership in NYC mirrors the city itself: Diverse, complex and highly localized.
Methodology
The data used in this study was sourced from the U.S. Census Bureau’s American Community Survey (ACS) 5-Year Estimates for 2024 (table S2501), collected at the census tract level. The following process was used to break down the data:
The Census tracts were mapped to NYC neighborhoods using PropertyShark boundaries. 30% of tracts crossed two or more neighborhoods. For tracts spanning multiple neighborhoods, housing figures were divided proportionally based on how much of the tract’s area fell within each neighborhood.
The ownership categories analyzed were:
- Married-couple families — a married couple living together with or without children
- Nonfamily — individuals living alone or only with non-relatives
- Female-led family households — a woman owning a family home without a spouse present, living with at least one relative; includes never-married, divorced, separated or widowed owners (also referred to as “female-led families” in this study)
- Male-led family households — same structure with a male owner (also referred to as “male-led families” in this study)
The figures were summed at the neighborhood level and ownership rates were calculated as a share of total occupied housing units.
Each top-10 neighborhood ranking shows the leading neighborhoods where a given ownership type holds its largest share. This measures concentration, not dominance, meaning that a neighborhood can top the list for female-led family ownership even if married owners remain the majority there.
Banner Image: Young couple moving into new home. Image Credit – Vitaly Gariev


There are no comments yet
Why not be the first